![]()
![]()
(Topic Last Updated On: 05/15/2018)
Reports > Corporate Dashboard
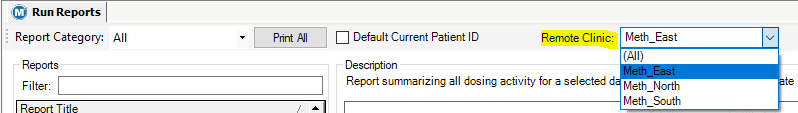
The Corporate Dashboard menu item, on the Reports menu, launches the Corporate Dashboard screen. The Corporate Dashboard feature is typically used by large corporations with multiple facilities spanning across different geographic regions within the same city, state, or country. This feature allows users to review census, intake and discharge, medication, and financial data for the company as a whole, per region, or per individual facility; all from one central Methasoft site. This alleviates the need for having to sign into each individual facilities Methasoft system to review data and run reports. Corporate Dashboard is a multifaceted feature including the Corporate Dashboard screen, built-in data portlets, graphs, interactive reports, and the ability to run reports for 'Remote Clinics' from the 'Run Reports' screen. Access to the Methasoft Corporate Dashboard site is security driven and typically reserved for the company's corporate administrative users. The Corporate Dashboard feature is an add-on to the Methasoft application and is not available for use out-of-the-box. This feature is a paid service that requires a Corporate Dashboard contract. Use of this feature involves a detailed setup process, which requires the build of a company specific Corporate Dashboard database/site and the configuration of multiple settings and preferences at each facility. Contact Methasoft Support for more information on having the Corporate Dashboard feature enabled.
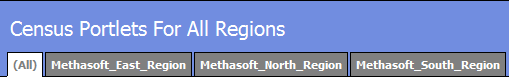
Corporate Regions
The top section of the screen displays the 'Corporate Regions'. Regions are separated into individual clickable tabs. Regions are established by the customer and configured during the Corporate Dashboard installation and configuration process. Individual 'Corporate Clinics' are associated with 'Corporate Regions' and appear once a Region is selected. The 'All' tab is the default selected Region tab, and includes all Regions data in the displayed Portlets. Selecting a Region tab will refresh the Portlets to display only the data for the clinics associated with that Region.
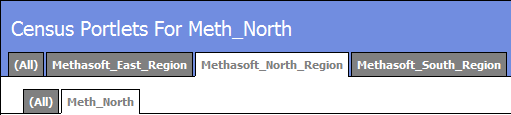
Corporate Clinics
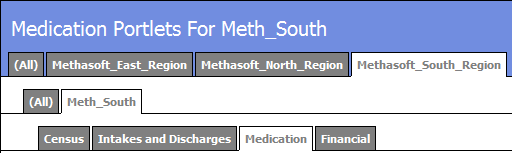
After a specific 'Corporate Region' tab has been selected, all 'Corporate Clinics' associated with that Region will appear below in the 'Corporate Clinics' section. Clinics are separated into individual clickable tabs. Selecting a Clinic tab will refresh the Portlets to display only the selected facilities data. The 'All' tab is the default selected Clinic tab, and displays data in the Portlets for all 'Corporate Clinics' under the selected 'Corporate Region'.
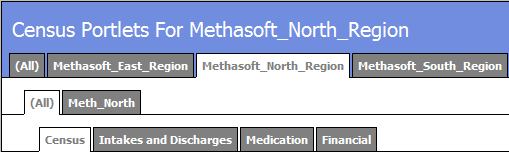
Portlet Categories
The four Corporate Dashboard 'Portlet Categories' are accessible by selecting the corresponding 'Portlet Category' tab. These tabs are located in the section below the 'Corporate Regions' and 'Clinics' sections. The selected 'Portlet Category' displays in the title header section of the screen. Selecting a 'Portlet Category' tab will refresh the Portlets section and display Portlets specific to the selected category.
Portlets
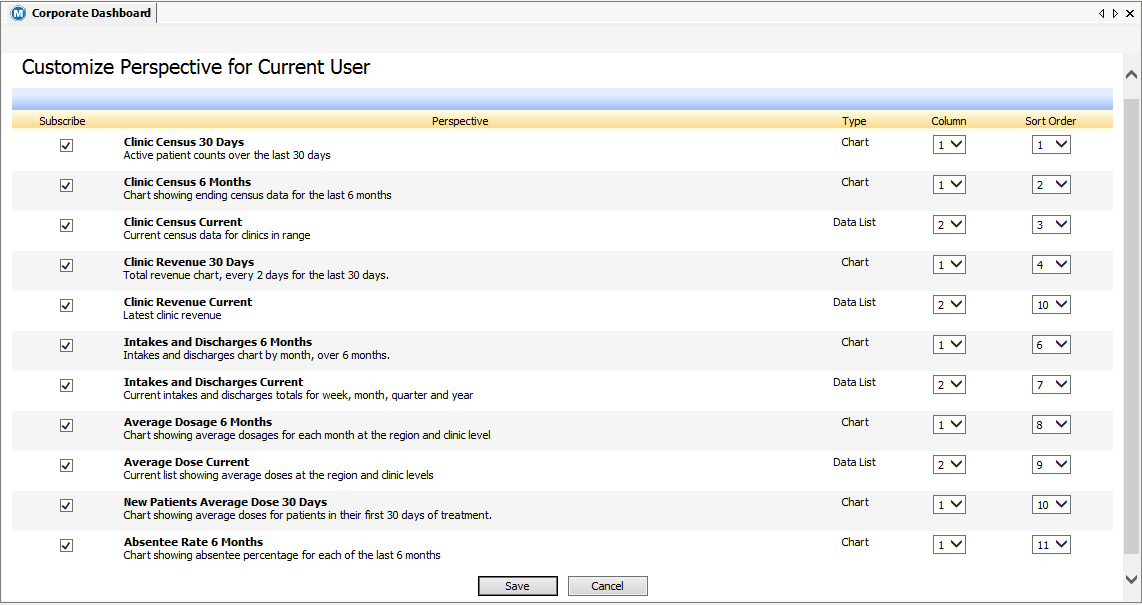
The Portlets section displays 'Portlet Category' specific graphs, tables, and report links. Portlets display in the main part of the screen, below the 'Portlet Category' section. Dependent on the selected 'Corporate Region', 'Clinic', and 'Portlet Category', the Portlet section will refresh and display data specific to these selections. Within each Portlet there are report hyperlinks that, when clicked, will load the report specific to the displayed Portlet data from the 'Run Reports' screen. Access to different Portlets is driven by the user's 'Subscription' selections made on the 'Customize Perspective for Current User' screen. From this secondary screen, column and sort order parameters can be configured. *See below Procedure section for more information.
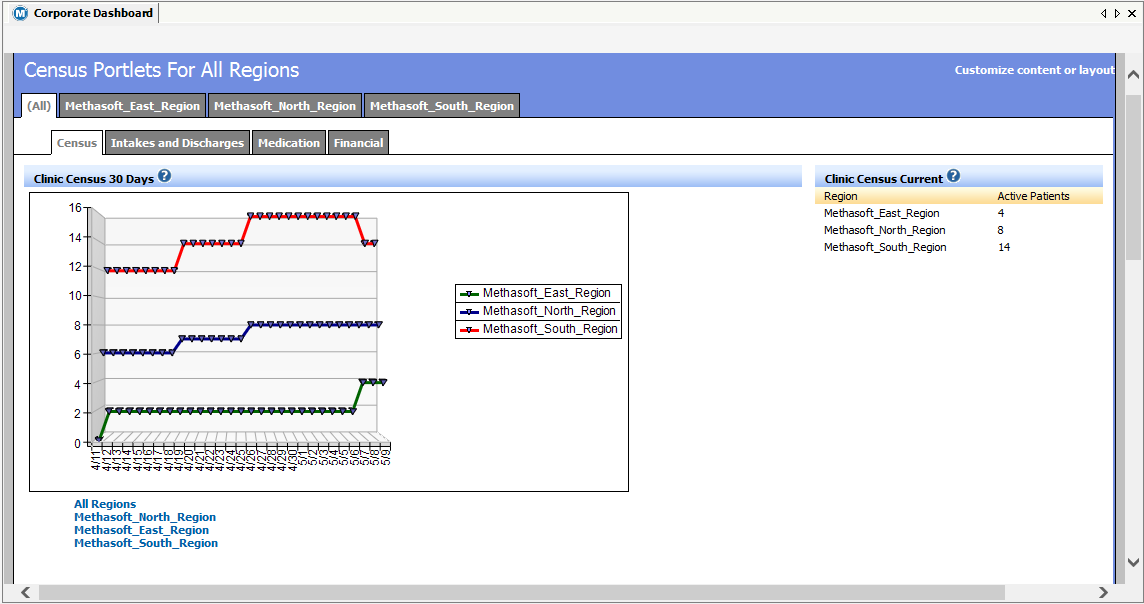
Census
The Census Portlet Category includes graphs and a data table displaying census numbers for the current census, the past 30 days, and the past 6 months.
Intake and Discharges
This Portlet Category details the Intake and Discharge numbers using a bar graph and data table. The portlet data table here shows the total intakes and discharges to date, going back 7 days, 30 days, 90 days, and 365 days; as well as the from and to dates for each date range.
Medication
Under the Medication Portlet Category are graphs and a data table showing the average dose amounts, per drug type, for the current date, for the past 30 days, and for the past 6 months.
Financial
The Financial Portlet Category contains a graph and data table showing the total revenue collected today and in the past 30 days. The table breaks down the collected revenue by 'Patient' and by '3rd Party' payers.
Customize Content or Layout
This hyperlink is located on the top right corner of the screen and launches the 'Customize Perspective for Current User' secondary screen. From this screen the user makes Portlet 'Subscription' selections that will display on the Corporate Dashboard screen. Portlet specific column and sort order parameters are also configured from this screen. *See below Procedure section for more information.
Report Links
Below each graph on the Corporate Dashboard screen there are clickable report links. Clicking the link loads the report that is specific to the data displayed in the graph.
Save
This button appears on the 'Customize Perspective for Current User' secondary screen. After making 'Subscription' selections and/or column and sort order changes, clicking this button applies these changes to the users Portlet display. Clicking this button also closes this secondary screen and returns the user to the main Corporate Dashboard screen.
Cancel
This button appears on the 'Customize Perspective for Current User' secondary screen. Clicking this button disregards any changes made, closes this secondary screen, and returns the user to the main Corporate Dashboard screen.
 (Close)
There is no 'Close' button on the Corporate Dashboard
screen. Clicking the button at the top right of the
tabbed window tool bar will close the screen.
1.) Clicking on the 'Corporate Dashboard' menu item on the 'Reports' menu, opens the Corporate Dashboard screen. Access to the Corporate Dashboard and it's associated Portlets is security driven. During the Corporate Dashboard setup process, administrators grant access for users/job roles to the Screen and Perspective Portlets using the Security Administration screen found on the Administration menu. *See the Security Administration topic for more information.
2.) By default, the very first time a user loads the Corporate Dashboard screen, no Portlets will appear. The user must 'Subscribe' to individual Portlets as detailed in the Procedure above.
3.) The 'All' Regions selection is the default setting when the Corporate Dashboard screen is opened or refreshed. Portlets will display the data of all Clinics, for all Regions when the 'All' Regions tab is selected.
4.) To display data for a specific region, click on that Region's tab in the Corporate Regions section of the screen.
5.) To display the data for a specific clinic, select the Region tab that the desired Clinic is associated with. Then select the Clinic from the 'Clinics' section of the screen.
6.) After making specific Corporate Region or Clinic selections, click on the specific 'Portlet Category' to view Portlets specific to that category.
7.) The Portlets will display the data specific to the Region and/or Clinic selections.
8.) Below each graph, there are clickable report links. Clicking the link loads the report specific to the data displayed in the graph.
9.) After reviewing the data from the Corporate Dashboard, click
on the
|
Corporate Intakes / Discharges Over Time
Corporate Average Dose Over Time
Corporate New Patient Average Dose First 30 Days
Corporate Absentee Rate Over Time