Report: Site Demographics by Time in Treatment Extended
(Topic Last Updated On: 05/05/2010)
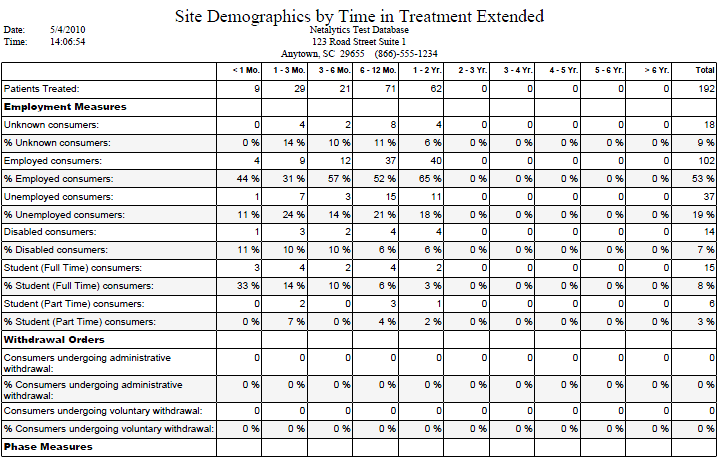
This report displays a breakdown of a facility's patient population by each patient's time in treatment, followed by a breakdown of various performance data also broken down by time in treatment. Time in treatment calculations are based on the more recent date of either a patient's Intake Date or Time in Treatment Starts On date, stored for each patient on the Dosing Information screen. This report is similar to the Site Demographics by Time in Treatment report, but is extended to provide a more detailed breakdown of time in treatment as well as percentage breakdowns. This report uses demographic data stored each night by Nightly Processes to allow users to run this report over a selected date range. Census, employment status, detoxification, phase level, pregnancy status, gender, treatment modality, race, dosage amount, marital status, age, billing provider usage, and drug screen data breakdowns are provided by this report. This report is generally run by administrators, accreditation bodies, other auditors or supervisors.
![]()
![]()
Report Section/Breakdown Explanations
Employment Measures
'(Employment Status) consumers' - Displays the number of patients with each 'Employment Status' (stored on the Patient Profile screen) during the selected date range.
Withdrawal Orders
'Consumers undergoing administrative withdrawal' - Displays the number of patients with at least one processed dosage change due to an entered 'Administrative Detox' on the Titrate/Detox Order screen during the selected date range.
'Consumers undergoing voluntary withdrawal' - Displays the number of patients with at least one processed dosage change due to an entered 'Voluntary Detox' on the Titrate/Detox Order screen during the selected date range.
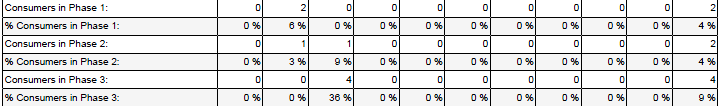
Phase Measures
'Consumers in (Phase Type)' - Displays the number of patients assigned to each 'Phase Type' on the Dosing Information screen during the selected date range.
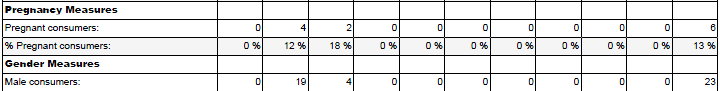
Pregnancy Measures
'Pregnant consumers' - Displays the number of patients marked as 'Pregnant' on the Patient Profile screen during the selected date range.
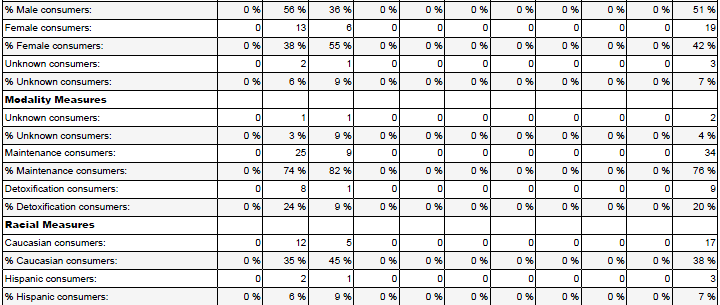
Gender Measures
'(Gender) consumers' - Displays the number of patients with each 'Gender' (stored on the Patient Profile screen) during the selected date range.
Modality Measures
'(Modality) consumers' - Displays the number of patients with each treatment 'Modality' (stored on the Patient Profile screen) during the selected date range.
Racial Measures
'(Race) consumers' - Displays the number of patients with each 'Race' (stored on the Patient Profile screen) during the selected date range.
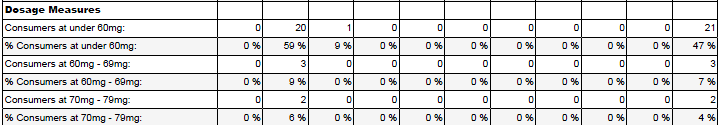
Dosage Measures
'Consumers at under 60mg' - Displays the number of patients with a total daily dosage amount (stored on the Dosing Information screen) less than 60mg/day during the selected date range.
'Consumers at (XXmg - XXmg range) ' - Displays the number of patients with a total daily dosage amount (stored on the Dosing Information screen) equal to or greater than the first 'XX' value and equal to or less than the last 'XX' value during the selected date range.
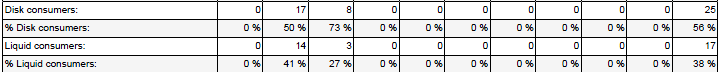
'(Dose Type) consumers' - Displays the number of patients taking a 'Dose Type' (stored on the Dosing Information screen) during the selected date range.
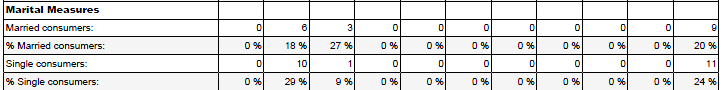
Marital Measures
'(Marital Status) consumers' - Displays the number of patients with each 'Marital Status' (stored on the Patient Profile screen) during the selected date range.
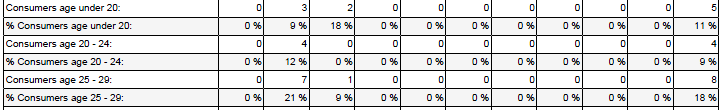
Age Measures
'Consumers age under 20' - Displays the number of patients under the age of 20 years old (calculated based on each patient's 'Birth Date', stored on the Patient Profile screen) during the selected date range.
'Consumers age (XX - XX range)' - Displays the number of patients with an age (calculated based on each patient's 'Birth Date', stored on the Patient Profile screen) equal to or greater than the first 'XX' value and equal to or less than the last 'XX' value during the selected date range.
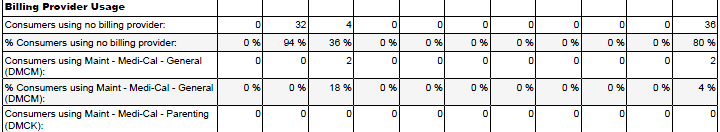
Billing Provider Usage
'Consumers using no billing provider' - Displays the number of patients without a 'Billing Provider' selected on the Payment Information screen during the selected date range.
'Consumers using (Billing Provider)' - Displays the number of patients assigned to each 'Billing Provider' on the Payment Information screen during the selected date range.
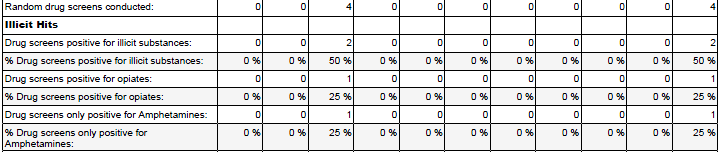
Drug Screen Data
'Random drug screens conducted' - Displays the number of patients with entered Drug Screen Test results with a 'Test Date' during the selected date range.
Illicit Hits
'Drug screens positive for illicit substances' - Displays the number of patients with entered Drug Screen Test results with a 'Test Date' during the selected date range that tested positive for at least one illicit substance.
'Drug screens positive for opiates' - Displays the number of patients with entered Drug Screen Test results with a 'Test Date' during the selected date range that tested positive specifically for opiates.
'Drug screens only positive for (substance)' - Displays the number of patients with entered Drug Screen Test results with a 'Test Date' during the selected date range that only tested positive for the specific illicit substance shown (This does not mean the patient tested negative for Methadone or Suboxone/Subutex).
(%) Percentage Calculations
For each of the above sections, the percentage value is calculated by dividing the number of patients by the number of patients appearing at the top of each column in the 'Patients Treated' field/row.
< 1 Mo. (Less than 1 month)
This column displays the number of patients for each report section with less than 3 months of time in treatment when the demographic/performance data for each report section was stored by system Nightly Processes. A patient's time in treatment is determined based on the more recent date of either the patient's stored 'Intake Date' or 'Time in Tx Starts On' date, stored for each patient on the Dosing Information screen.
1 - 3 Mo. (1 to 3 months)
This column displays the number of patients for each report section with 1 to 3 months of time in treatment when the demographic/performance data for each report section was stored by system Nightly Processes. A patient's time in treatment is determined based on the more recent date of either the patient's stored 'Intake Date' or 'Time in Tx Starts On' date, stored for each patient on the Dosing Information screen.
3 - 6 Mo. (3 to 6 months)
This column displays the number of patients for each report section with 3 to 6 months of time in treatment when the demographic/performance data for each report section was stored by system Nightly Processes. A patient's time in treatment is determined based on the more recent date of either the patient's stored 'Intake Date' or 'Time in Tx Starts On' date, stored for each patient on the Dosing Information screen.
6 - 12 Mo. (6 to 12 months)
This column displays the number of patients for each report section with 6 to 12 months of time in treatment when the demographic/performance data for each report section was stored by system Nightly Processes. A patient's time in treatment is determined based on the more recent date of either the patient's stored 'Intake Date' or 'Time in Tx Starts On' date, stored for each patient on the Dosing Information screen.
1 - 2 Yr. (1 to 2 years)
This column displays the number of patients for each report section with 1 to 2 years of time in treatment when the demographic/performance data for each report section was stored by system Nightly Processes. A patient's time in treatment is determined based on the more recent date of either the patient's stored 'Intake Date' or 'Time in Tx Starts On' date, stored for each patient on the Dosing Information screen.
2 - 3 Yr. (2 - 3 years)
This column displays the number of patients for each report section with 2 to 3 years of time in treatment when the demographic/performance data for each report section was stored by system Nightly Processes. A patient's time in treatment is determined based on the more recent date of either the patient's stored 'Intake Date' or 'Time in Tx Starts On' date, stored for each patient on the Dosing Information screen.
3 - 4 Yr. (3 - 4 years)
This column displays the number of patients for each report section with 3 to 4 years of time in treatment when the demographic/performance data for each report section was stored by system Nightly Processes. A patient's time in treatment is determined based on the more recent date of either the patient's stored 'Intake Date' or 'Time in Tx Starts On' date, stored for each patient on the Dosing Information screen.
4 - 5 Yr. (4 - 5 years)
This column displays the number of patients for each report section with 4 to 5 years of time in treatment when the demographic/performance data for each report section was stored by system Nightly Processes. A patient's time in treatment is determined based on the more recent date of either the patient's stored 'Intake Date' or 'Time in Tx Starts On' date, stored for each patient on the Dosing Information screen.
5 - 6 Yr. (5 to 6 years)
This column displays the number of patients for each report section with 5 to 6 years of time in treatment when the demographic/performance data for each report section was stored by system Nightly Processes. A patient's time in treatment is determined based on the more recent date of either the patient's stored 'Intake Date' or 'Time in Tx Starts On' date, stored for each patient on the Dosing Information screen.
> 6 Yr. (Greater than 6 years)
This column displays the number of patients for each report section with more than 6 years of time in treatment when the demographic/performance data for each report section was stored by system Nightly Processes. A patient's time in treatment is determined based on the more recent date of either the patient's stored 'Intake Date' or 'Time in Tx Starts On' date, stored for each patient on the Dosing Information screen.
Total
This column displays the total number of patients for each report section over the report's selected date range, regardless of time in treatment. The sum of the previous 10 columns will equal this number.
Patients Treated
This field appears at the top of this report, and displays a breakdown of the total number of active patients in the facility during the selected date range, broken down by each patient's time in treatment.
From Date
This parameter allows users to limit the report's data by only displaying patient demographic statistics for data entered on or after the date selected here.
To Date
This parameter allows users to limit the report's data by only displaying patient demographic statistics for data entered on or before the date selected here.