(Topic Last Updated On: 05/05/2010)
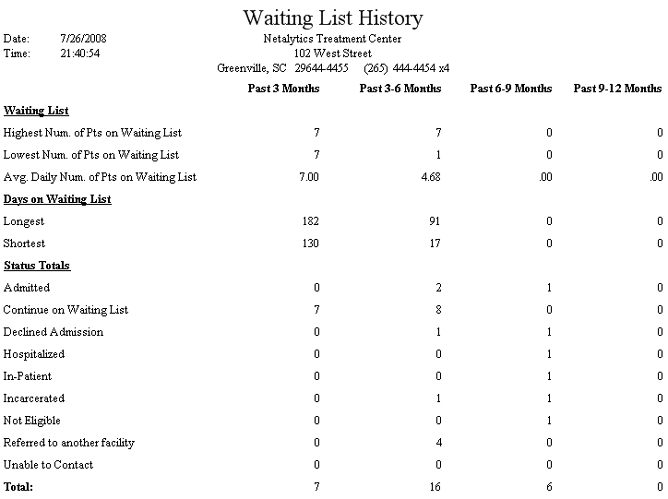
This report displays a historical summary of the number of people seeking admission to a facility who are entered and tracked on the Waiting List screen. The number of people on the waiting list is broken down quarterly over the past 12 months from the date on which this report is generated, and then further broken down by waiting list status. Other waiting list statistics are provided for each quarter, including the highest/lowest/average numbers of people on the waiting list and the longest and shortest waits in days. A referral breakdown is also provided at the bottom of this report displaying the number of referrals over the past year referred to each referral agency.


Past 3 Months
This column displays waiting list total data for the last 3 months from the date on which this report is generated.
Past 3-6 Months
This column displays waiting list total data for the last 3-6 month quarter from the date on which this report is generated.
Past 6-9 Months
This column displays waiting list total data for the last 6-9 month quarter from the date on which this report is generated.
Past 9-12 Months
This column displays waiting list total data for the last 9-12 month quarter from the date on which this report is generated.
Waiting List
This section displays the highest, lowest, and average number of people on the waiting list for each quarter of the past year.
Days on Waiting List
This section displays the longest and shortest period of days any one person waited on the waiting list for each quarter of the past year.
Status Totals
This section displays the total number of people entered on the waiting list with each 'Status' for each quarter of the past year.
Referral By Agency
This section displays the total number of patient referrals entered on the Make Referral screen over the past year, broken down by the 'Referral Agency' selected for each.