Report: Drug Screen Results - Unacceptable Results Summary
(Topic Last Updated On: 06/26/2018)
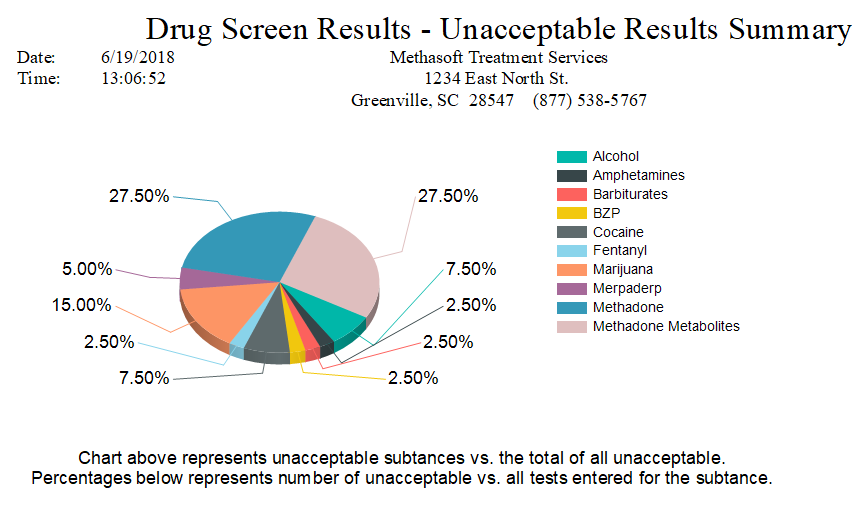
This report displays summary level details of unacceptable Drug Screen Results recorded over a specified date range. The report is segmented into 3 sections: The top section displays a graphical representation of unacceptable Drug Screen Results recorded in the specified date range. The middle section displays totals and percentages of acceptable and unacceptable Drug Screen Results for the selected date range. The bottom section displays a breakdown of the totals per substance (drug type).
Unacceptable vs. Total of All Unacceptable Pie-Chart
This color coded pie-chart appears in the top section of the report and is a representation of unacceptable substances verses the total of all unacceptable drug screen types within the specified date range. Percentages are displayed for each drug type and all drug types, included in the graph, are assigned a unique color and listed in a key to the right.
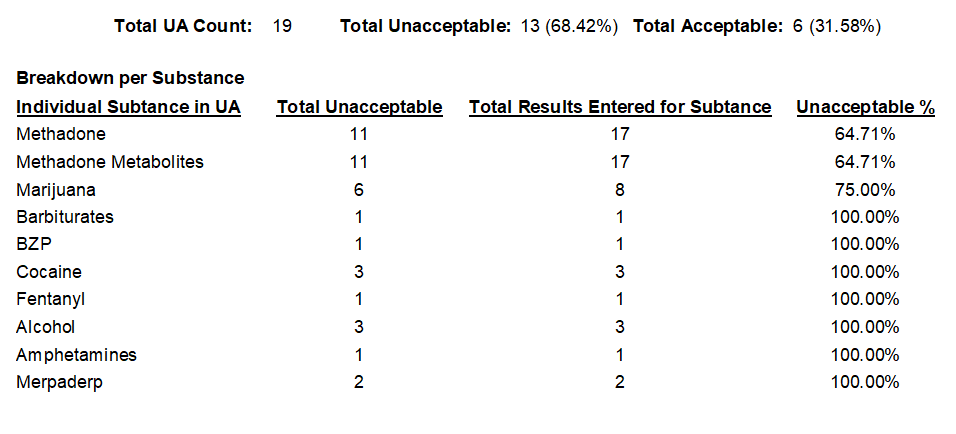
Individual Substance in UA
This column appears in the bottom section of the report, and displays the name of the drug as it appears on the Drug Screen Results screen.
Total Unacceptable
This column appears in the bottom section of the report, and displays the total number of unacceptable Drug Screen Results, for that drug type, recorded over the selected date range.
Total Results Entered for Substance
This column appears in the bottom section of the report, and displays the total number of positive Drug Screen Results for that drug type over the selected date range.
Unacceptable %
This column appears in the bottom section of the report, and displays the percentage of unacceptable Drug Screen Results recorded for that drug type over the selected date range.
Total UA Count
This field appears in the middle section of the report, and displays the total number of Drug Screens recorded on the Drug Screen Results screen within the specified date range.
Total Unacceptable
This field appears in the middle section of the report, and displays the total number and percentage of unacceptable Drug Screen Results recorded on the Drug Screen Results screen within the specified date range.
Total Acceptable
This field appears in the middle section of the report, and displays the total number and percentage of acceptable Drug Screen Results recorded on the Drug Screen Results screen within the specified date range.
From Date
This parameter is used to select or enter the start date of the desired date range. The report will retrieve data from patient Drug Screen Result records with a 'Test Date' on or after the selected date.
To Date
This parameter is used to select or enter the end date of the desired date range. The report will retrieve data from patient Drug Screen Result records with a 'Test Date' on or before the selected date.
Test Type
This parameter allows users to generate the report for a specific Drug Screen Test Type.
Event Type
This parameter allows users to generate the report for a specific Drug Screen Event Type.
Counselor ID
This parameter allows users to select a Counselor from the dropdown list, and generate the report specifically for the selected Counselors caseload.
Drug Name
This parameter contains a checkbox list of all drug types, allowing the user to select which specific drugs to include in the report. By default, with no drug types selected, the report generates data for all drugs listed.